Courses
Welcome to Statistics Course
About Course
Statistics is the science of data to get the pattern of values and make a record of business details. At MathWise, you’ll learn a wide range of statistics courses
What will you Learn in Statistics Course?
This course addresses fundamental subjects like polynomials, functions, and linear and quadratic equations, and is intended to provide students with a solid foundation in algebraic principles and problem-solving techniques. We will learn:
i. Exploring categorical data
iii. Fractions, decimals, and percentages
v. Mean absolute deviation
vii. Constructing scatter plots
ix. Variance and standard deviation
xi. Percentiles,Z-scores
xii. permutations and combinations
ii. Bar graphs
iv. Mean, median, and mode
vi. Estimating slope of line of best fit
viii. Simple probability
x. Interquartile range (IQR)

Course Content
UNIT 1:Analyzing data in categories
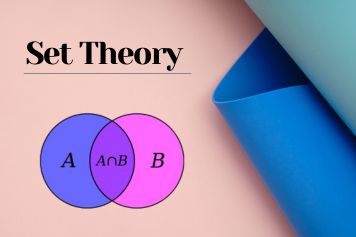
Techniques for handling categorical data are covered in this unit. Discover how to identify patterns and correlations in category data by using bar graphs, Venn diagrams, and two-way tables.
UNIT 2: Quantitative Data Exploration
Some fundamental techniques for graphing quantitative data distributions, such as stem and leaf plots, histograms, and dot plots, are covered in this subject. We'll also look at how to compare the features of other distributions using those displays.
UNIT 3: Quantitative Data Summary
Common center measurements like mean and median are included in this unit. Additionally, we will study how to quantify variability and spread using the standard deviation and interquartile range, and we will apply these concepts to identify data that may be classified as outliers.
UNIT 4: Quantitative Data Analysis: Percentiles & Z-Scores
We'll learn how to model distributions with density curves, how to assess the position of data within a distribution using percentiles and z-scores, what happens when we transform data, and an examination of one of the most significant families of distributions: the normal distributions.
UNIT 5: Bi-Variate Quantitative Analysis
The link between two quantitative variables is investigated using scatter plots, and the relationship is modelled and predictions are made using regression. This section looks at linear regression and how to evaluate a linear model's strength.
UNIT 6: Collecting data
Forming questions and acquiring data to investigate them are the fundamental components of statistics. This section links these inquiries to elements of research design, such as fundamental experiment design, observational studies, and sample and survey techniques.
UNIT 7: Probability
Here, we'll delve deeply into the various methods available for determining the probability of certain occurrences. We'll lay a strong foundation by applying simulations and the addition and multiplication rules, which will enable us to solve statistical problems in the future.
UNIT 8: Random variables and probability distributions
in this unit we will determine the expected value and probability of each random variable, as well as how to combine and transform them.
UNIT 9: Sampling distributions
A sampling distribution helps us utilize samples to estimate the probability. The behavior of sample means and proportions in repeated samples is covered in this unit.
UNIT 10: Quantitative Mean Inference
This section will provide you with the tools to construct an inference from a population mean to make predictions about quantitative outcomes, ranging from quality control to forecasting the amount of snowfall that would result from an impending storm.
Importance
Why Choose Our Statistics Course?
Statistics is the backbone of informed decision-making, from business analytics to scientific research.Our instructors are seasoned statisticians with a passion for demystifying data analysis.We bring statistics to life through interactive lessons, real-world case studies, and practical applications.
Join us on this statistical journey and unlock the power of data analysis.
Contact us for personalized online tutoring for Statistics